
Mass Spectrometry Imaging for Biomedical Applications
Katy Margulis
We employ desorption electrospray ionization mass spectrometry imaging (DESI-MSI) to study a variety of pathophysiological processes in living tissues, to distinguish between tissues of various pathologies, and to guide drug discovery.
In DESI-MSI, tissue sections are scanned directly without any sample preparation and with minimal in-process damage, mapping their chemical composition in two-dimensional manner. To desorb and ionize the target molecules, a beam of charged droplets is directed to the tissue surface, extracting compounds into secondary droplets that are subsequently analyzed by the mass spectrometer. A program-controlled moving stage is used to scan the entire surface of the sample, while the mass spectra are recorded as a function of the x,y-position on the tissue. A two-dimensional distribution image with relative signal intensity can be generated for any specific m/z value. Hence, a single scan enables acquiring the richest chemical information per pixel, obviating the need for a specific molecular targeting, and allowing for a spatial co-localization of different molecules. Atmospheric pressure ionization conditions, minimal requirements for sample preparation, non-destructive scanning process and high sensitivity make this imaging technique exceptionally valuable for detecting chemical changes in tissue caused by pathological processes or pharmacological intervention.
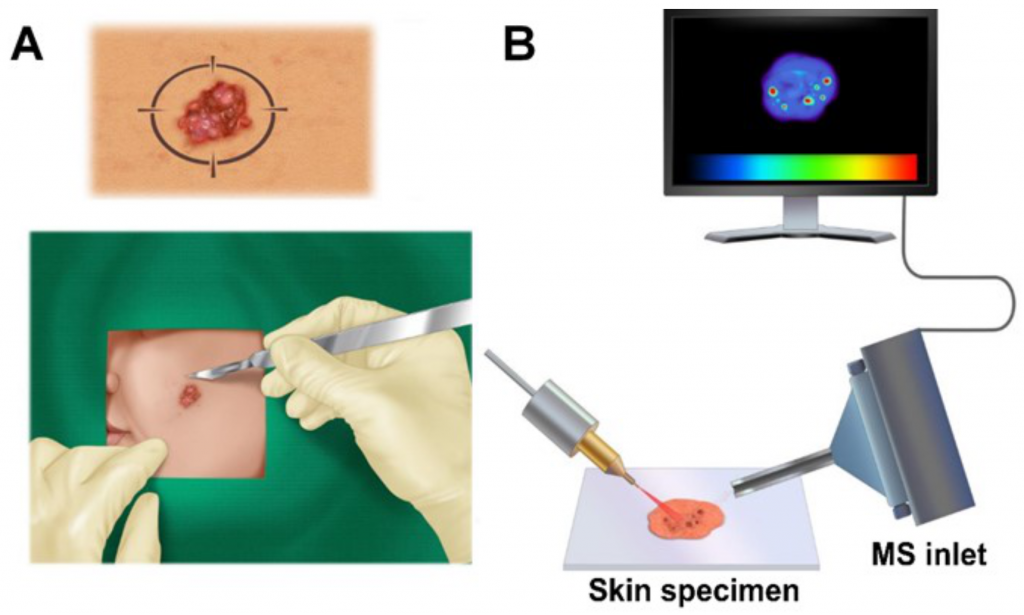
Figure 1. (A) Skin lesion suspected as BCC is removed during Mohs surgery and sectioned; (B) Excised skin sections are imaged by DESIMS to detect microscopic tumors.
Basal cell carcinoma diagnostics.
We established the capability DESIMSI to distinguish between micrometer-sized tumor aggregates of basal cell carcinoma (BCC), a common skin cancer, and normal human skin. We analyzed 86 human specimens collected during Mohs micrographic surgery for BCC to cross-examine spatial distributions of numerous lipids and metabolites in BCC aggregates versus adjacent skin (Figure 1). Statistical analysis using the least absolute shrinkage and selection operation (Lasso) was employed to categorize each 200-µm diameter picture element (pixel) of investigated skin tissue map as BCC or normal. Lasso yielded an overall 94.1% diagnostic accuracy pixel by pixel of the skin map. We suggest that DESI-MSI/Lasso analysis is not limited to the diagnosis of BCC but should be applicable to a wide range of microscopic tumors.
Studying pathogenesis of oncogene-driven tumors and identifying new pharmacological targets.
We study initiation, progression and regression of tumors driven by various oncogenes in conditional transgenic mouse models. In these models we can intentionally activate and deactivate the oncogene in a specific organ to induce and regress the tumors. By DESI-MSI we monitor lipids and metabolites altered in each stage of tumor development and regression, which gives us insights on tumor pathogenesis and allows us to identify novel targets for pharmacological intervention (Figure 2).
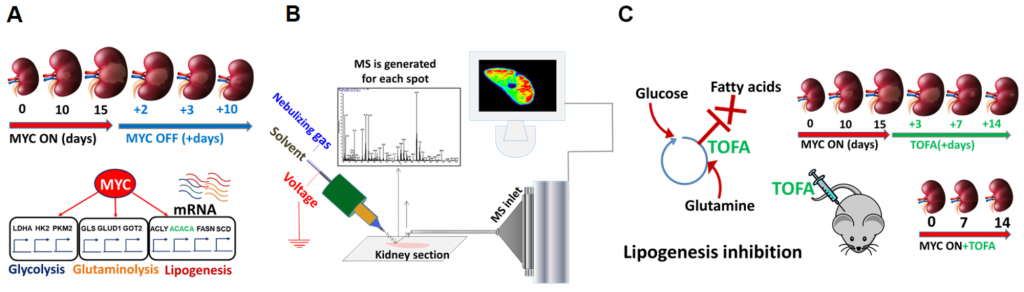
Figure 2. (A) Kidney tumor (renal cell carcinoma) is initiated and subsequently regressed by activation and deactivation of MYC oncogene in conditional transgenic mice; (B) Kidney sections are imaged by DESI-MS to detect metabolic changes during tumor initiation, progression and regression; (C) Novel therapeutic targets are identified based on the information obtained by DESI-MSI, and pharmacological intervention is tested in mice models.